
Overview: Why We Needed Observability
I’m one of the founding members of Ataccama’s recently assembled Observability team. Before our team was formed, observability at Ataccama lacked structure. There were multiple tools but no clear ownership. Dashboards existed, but their quality varied wildly. Metrics and logs were collected, but fine-tuning and best practices were often overlooked. Observability was more of an afterthought than an intentional process.
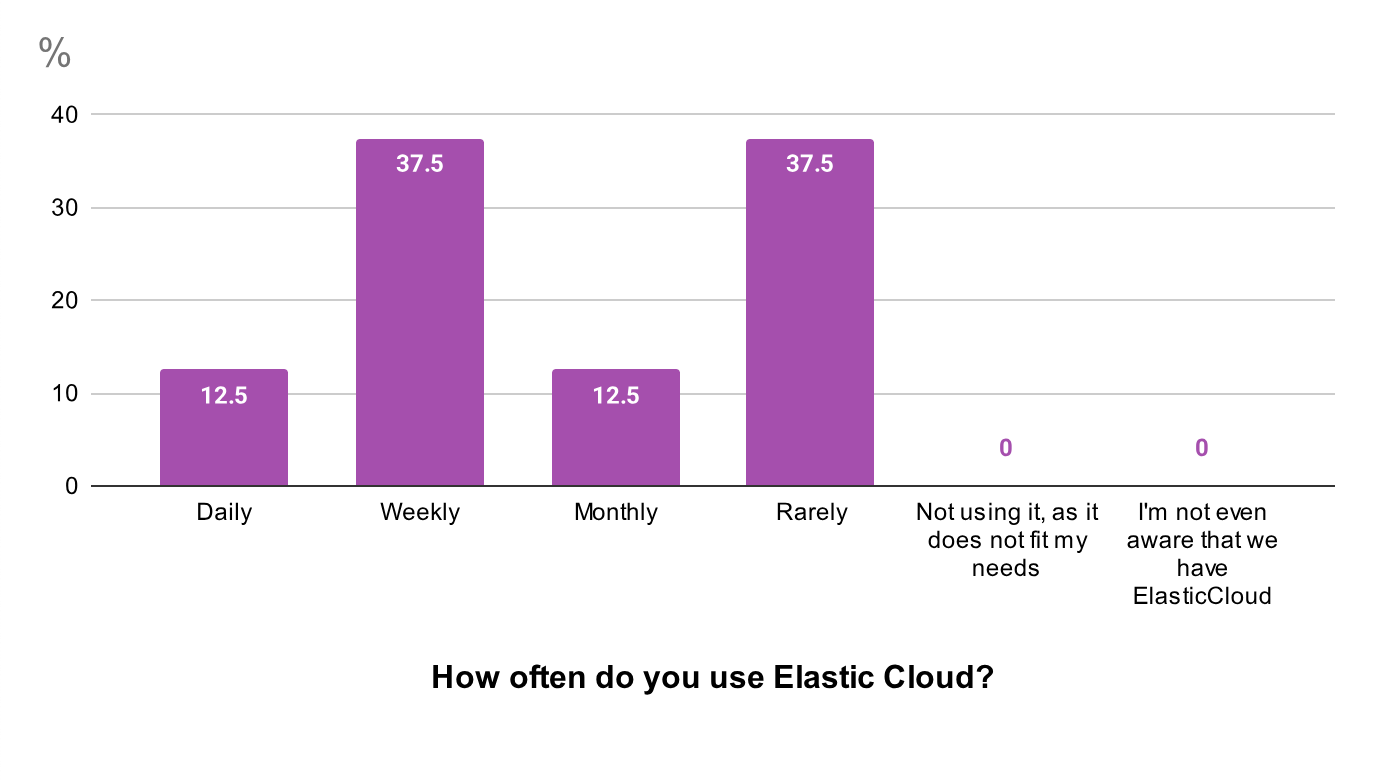
An internal survey confirmed what we already sensed - our existing logging solution wasn’t working for many users. Initially, we selected Elastic Cloud as a quick and simple solution for one of our older products. It was intended to be only temporary, but it stayed with us for almost two years. Over time, the lack of clear ownership, inconsistent configuration, and limited user adoption exposed its shortcomings. Around 37% of users didn’t touch Elastic Cloud at all, and another 37% only logged in weekly. Their feedback was clear:
- “Kibana is a terrible interface to process logs.”
- “You need domain knowledge just to find anything useful.”
- “Configuring mappings and field types is too complex.”
- “The UI is overcomplicated.”
 There was also no tracing solution at all, meaning we lacked visibility into how requests flowed through our distributed systems. Without traces, debugging complex issues and identifying performance bottlenecks required a lot of manual effort and guesswork.
Recognizing the strategic importance of Observability, Ataccama’s leadership provided a strong mandate to overhaul our approach. With full backing from company leadership, a dedicated Observability team was established to drive this transformation. Combining internal talent with new hires like myself, we had the right mix of institutional knowledge and fresh perspectives to redefine how Observability could work for the company.
The Growing Insights
Our first task was clear — assess the current state, gather input from engineering teams, and explore future options.
We anticipated several challenges when revamping our Observability stack: resistance from teams, lengthy migrations, and difficulties retraining engineers on new tools.
Surprisingly, we faced no resistance from users. Most were frustrated with the old tools, and many had already stopped using them entirely. That lack of attachment gave us the freedom to rethink everything from scratch, prioritizing what mattered most for our engineers instead of trying to patch a broken system.
We also benefited from the fact that Grafana was already widely used for metrics visualization. This familiarity helped reduce the learning curve, making it easier for teams to embrace the new stack.
Choosing the Right Tools
With a clear picture of what wasn’t working, we could finally focus on choosing the right tools.
Time was a major factor. Ataccama was developing a new SaaS product, and our observability platform needed to be ready to support engineers and developers from the start.
Luckily, we had almost complete freedom to pick the tools we believed were best. The biggest constraint was the budget. Given our internal audit and security policies requiring us to retain logs for several months, we know that SaaS solutions can be very costly, especially if you want to store data for an extended period of time.
We knew from the start we wanted to move away from Elastic Cloud — user feedback made that decision easy. We evaluated several options, including SaaS offerings like Datadog.
Datadog's powerful UI and easy deployment were tempting, but the high price and limited data residency options made it a poor fit. The final price, considering long retention, ease of integration, and good documentation, were the main criteria.
Ultimately, we chose to build our own self-hosted LGTM stack — Loki for logs, Mimir for metrics, and Tempo for traces, all visualized in Grafana.
I, along with another team member, had positive experiences with this stack in the past, and it gave us the right balance of cost control, flexibility, multi-region support, and the possibility to migrate to Grafana Cloud in the future if needed.
It wasn’t the easiest option, but it gave us complete control — something we knew would pay off in the long run.
Architecture Overview
We also knew from the beginning that building a self-hosted stack wouldn’t be the easiest path. Choosing a fully managed SaaS solution could have significantly shortened the implementation time—perhaps to just a month or so. I can’t say exactly how much faster it would have been, but we know that having full control over our stack has proven invaluable. In the long run, it’s also a more cost-effective solution for us.
Our Observability stack runs on AWS EKS clusters, the same platform hosting most of our SaaS workloads. Because Ataccama serves customers globally, data residency is a core requirement. We operate multiple EKS clusters in different regions, ensuring data stays local where required.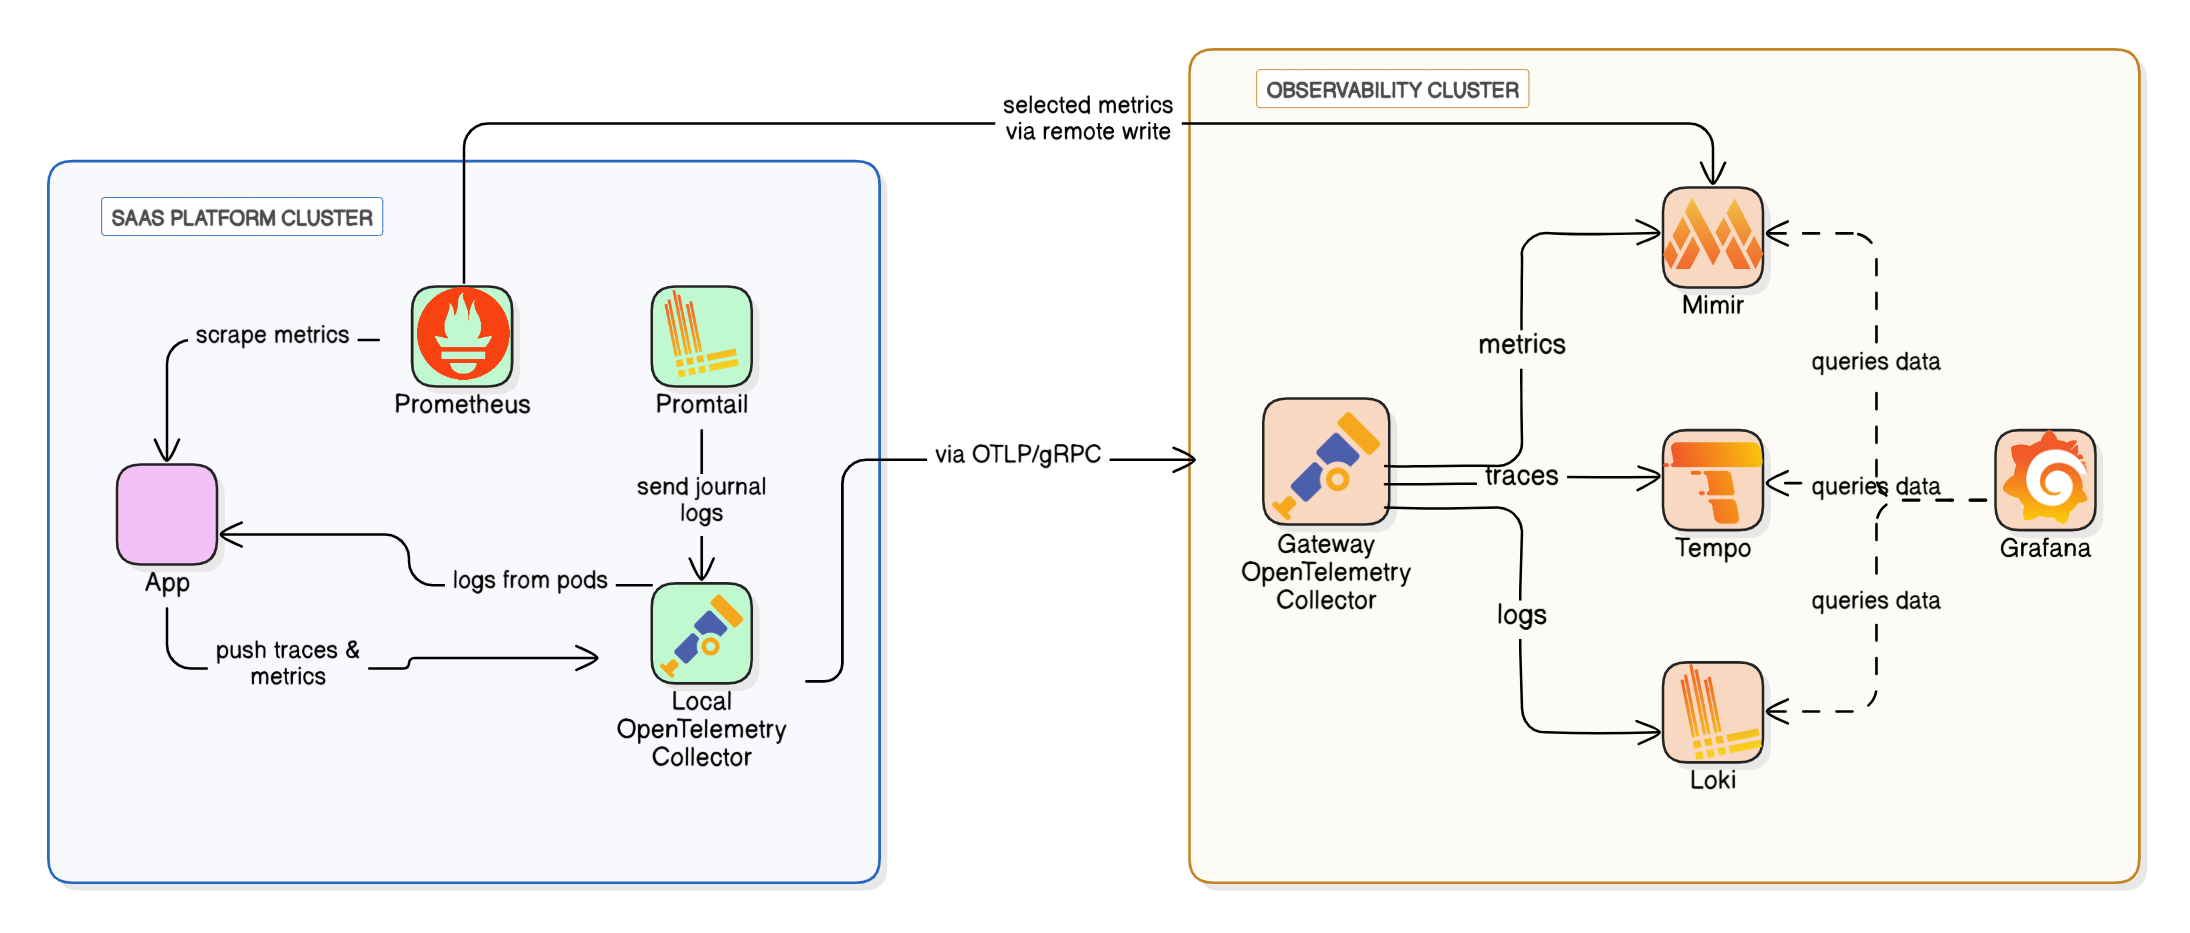
Data Collection
In each EKS cluster running our SaaS workloads (SaaS Platform Cluster), we collect data using:
- Promtail for system-level logs (journal logs) from nodes
- OpenTelemetry collectors gather application logs directly from pods, along with traces and metrics emitted by our applications
- Prometheus for infrastructure and application metrics, with an allow-listed set of metrics pushed via remote write to a remote Mimir instance
Central Processing and Storage
All data flows into the observability cluster in the corresponding region, hosting:
- Loki for logs
- Mimir for metrics
- Tempo for traces
- A gateway OpenTelemetry collector routes data from platform clusters to the appropriate backend within the observability cluster
- Local Grafana for querying and visualization
All data is stored in S3, keeping storage costs low. We currently retain logs and metrics for 100 days and traces for 31 days. For reference, we store approximately 6.2 TB of logs, 4.7 TB of metrics, and 2 TB of traces for that retention period with a daily ingest rate of 62 GB of logs, 47 GB of metrics, and 64.5 GB of traces. For transparency, our observability stacks (all regions) cost us roughly 7,400 USD monthly.
User Access
One of the observability clusters also hosts a central Grafana instance, which ties everything together. Engineers only need to remember one URL, where they can access logs, metrics and traces — even if the data is spread across continents. This simplifies onboarding and ensures teams always have a consistent point of entry.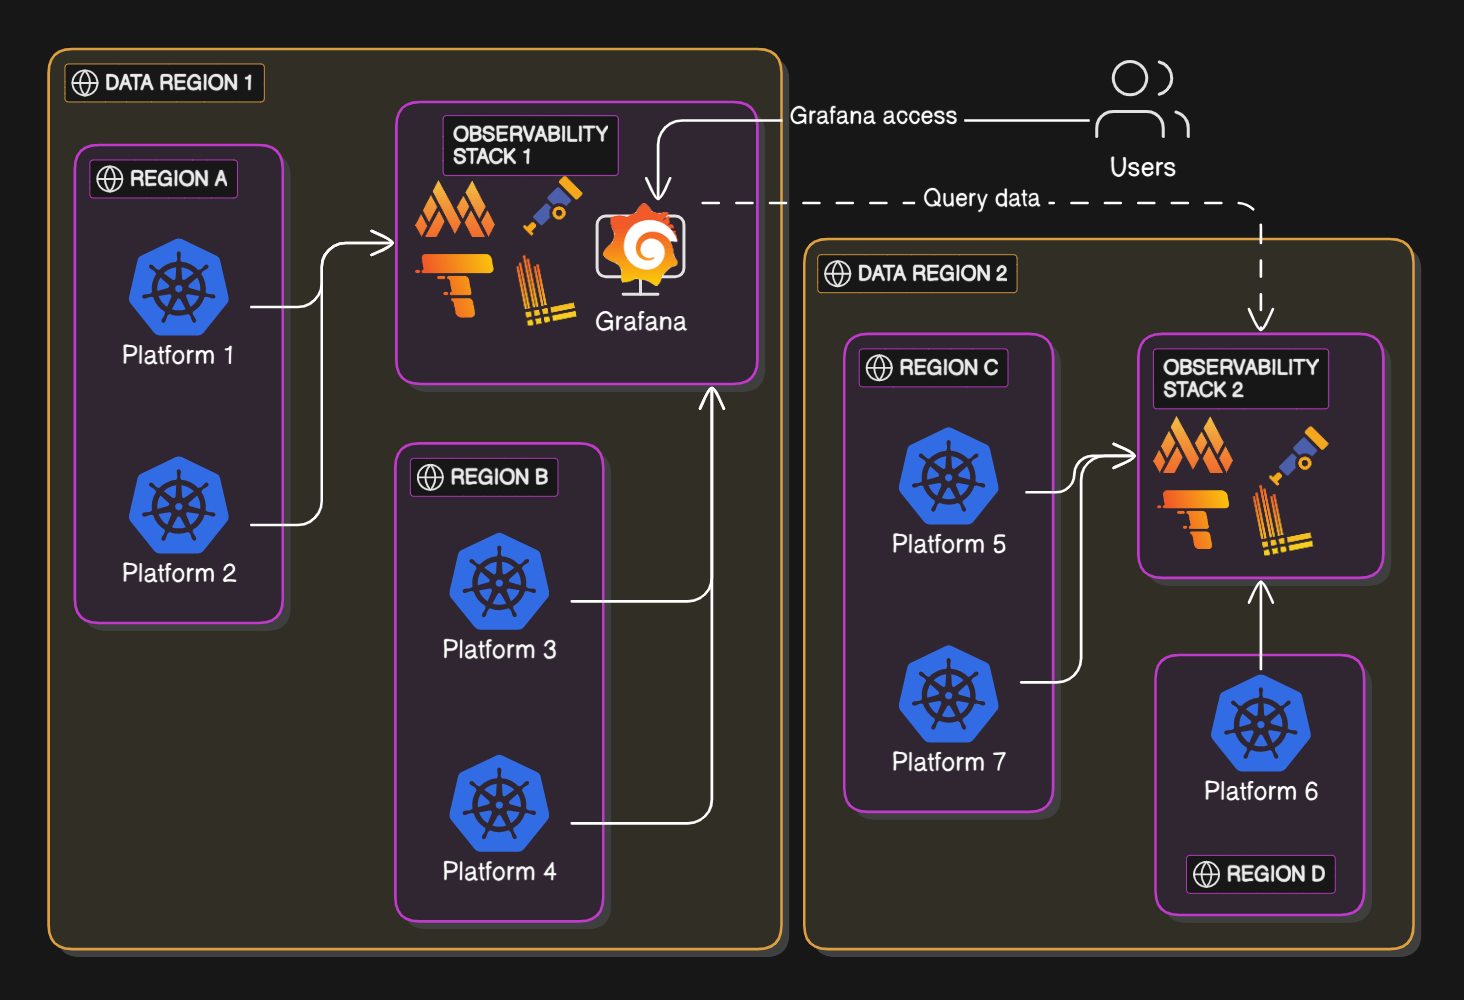
The Implementation Journey
Rolling out our observability stack wasn’t something we could do all at once. With a small team and limited capacity, we needed to phase it out, focusing on one component at a time.
We started with logs, replacing Elastic Cloud with Loki. Logs were the top priority, and delivering quick improvements helped build trust. Once Loki was running smoothly, we moved on to Mimir for metrics. Finally, we added Tempo for traces — there was no existing tracing solution, so the demand was lower.
One of the first challenges was data volume estimation and adequate sizing. We could only make best guesses about how much data we’d generate. In the end, we slightly underestimated costs but still stayed within budget.
Another surprise was cross availability zones (AZ) data transfer costs in AWS — something we didn’t fully anticipate. To mitigate that, we tweaked our deployment to keep some Mimir and Tempo components within a single AZ using nodeSelectors. It’s a minor compromise in high availability, but we felt it was acceptable for metrics and traces.
We also set the replication factor to 1 for Mimir and Tempo and enabled gRPC compression for internal communication between components, further reducing costs. From the start, internal communication was a priority.
We kept the teams informed about roadmaps, upcoming changes, and how the new platform would impact their workflows. To make adoption easy, we also ran several internal intro and demo sessions, including live Q&A. The goal was simple — make it as easy as possible for teams to get started.
Observability in Action: Real Impact and Cultural Shift
The impact of our new observability stack was noticeable almost immediately. The way engineers approached troubleshooting and debugging changed dramatically.
Before, many relied on kubectl logs, manually pulling logs from individual Kubernetes pods. It was slow, inefficient, and required deep knowledge of pod structures. Now, Grafana is the go-to tool for log searching and incident investigation, significantly improving Mean Time to Resolution (MTTR).
Another big shift was how teams documented and communicated incidents. It became common for engineers to attach screenshots from Grafana to Jira tickets and Slack conversations. Many also started sharing direct links to time-filtered views of logs, metrics, or traces—eliminating ambiguity and making collaboration easier across teams.
One major improvement we’ve gained is the ability to measure adoption, which was impossible before. We can now see how often teams use the platform, which data sources they rely on, and where gaps still exist.
To help teams get the most out of the platform, we also integrated observability directly into our product. With just a few clicks, our colleagues can be redirected to Grafana with a pre-filled query, showing them the relevant logs and metrics they need right away.
What we’ve also realized is that observability isn’t just about the stack itself—it’s about continuous collaboration with teams. The tools are important, but the real value comes from regular discussions with teams, iterating based on their needs, and helping them fully understand how to make observability part of their daily work.
Ownership also improved. Previously, observability was a gray area—no single team was responsible. Now, with a dedicated Observability team, engineers know where to go for help with dashboards, monitoring setups, or OTLP instrumentation. This has boosted adoption and streamlined troubleshooting across teams.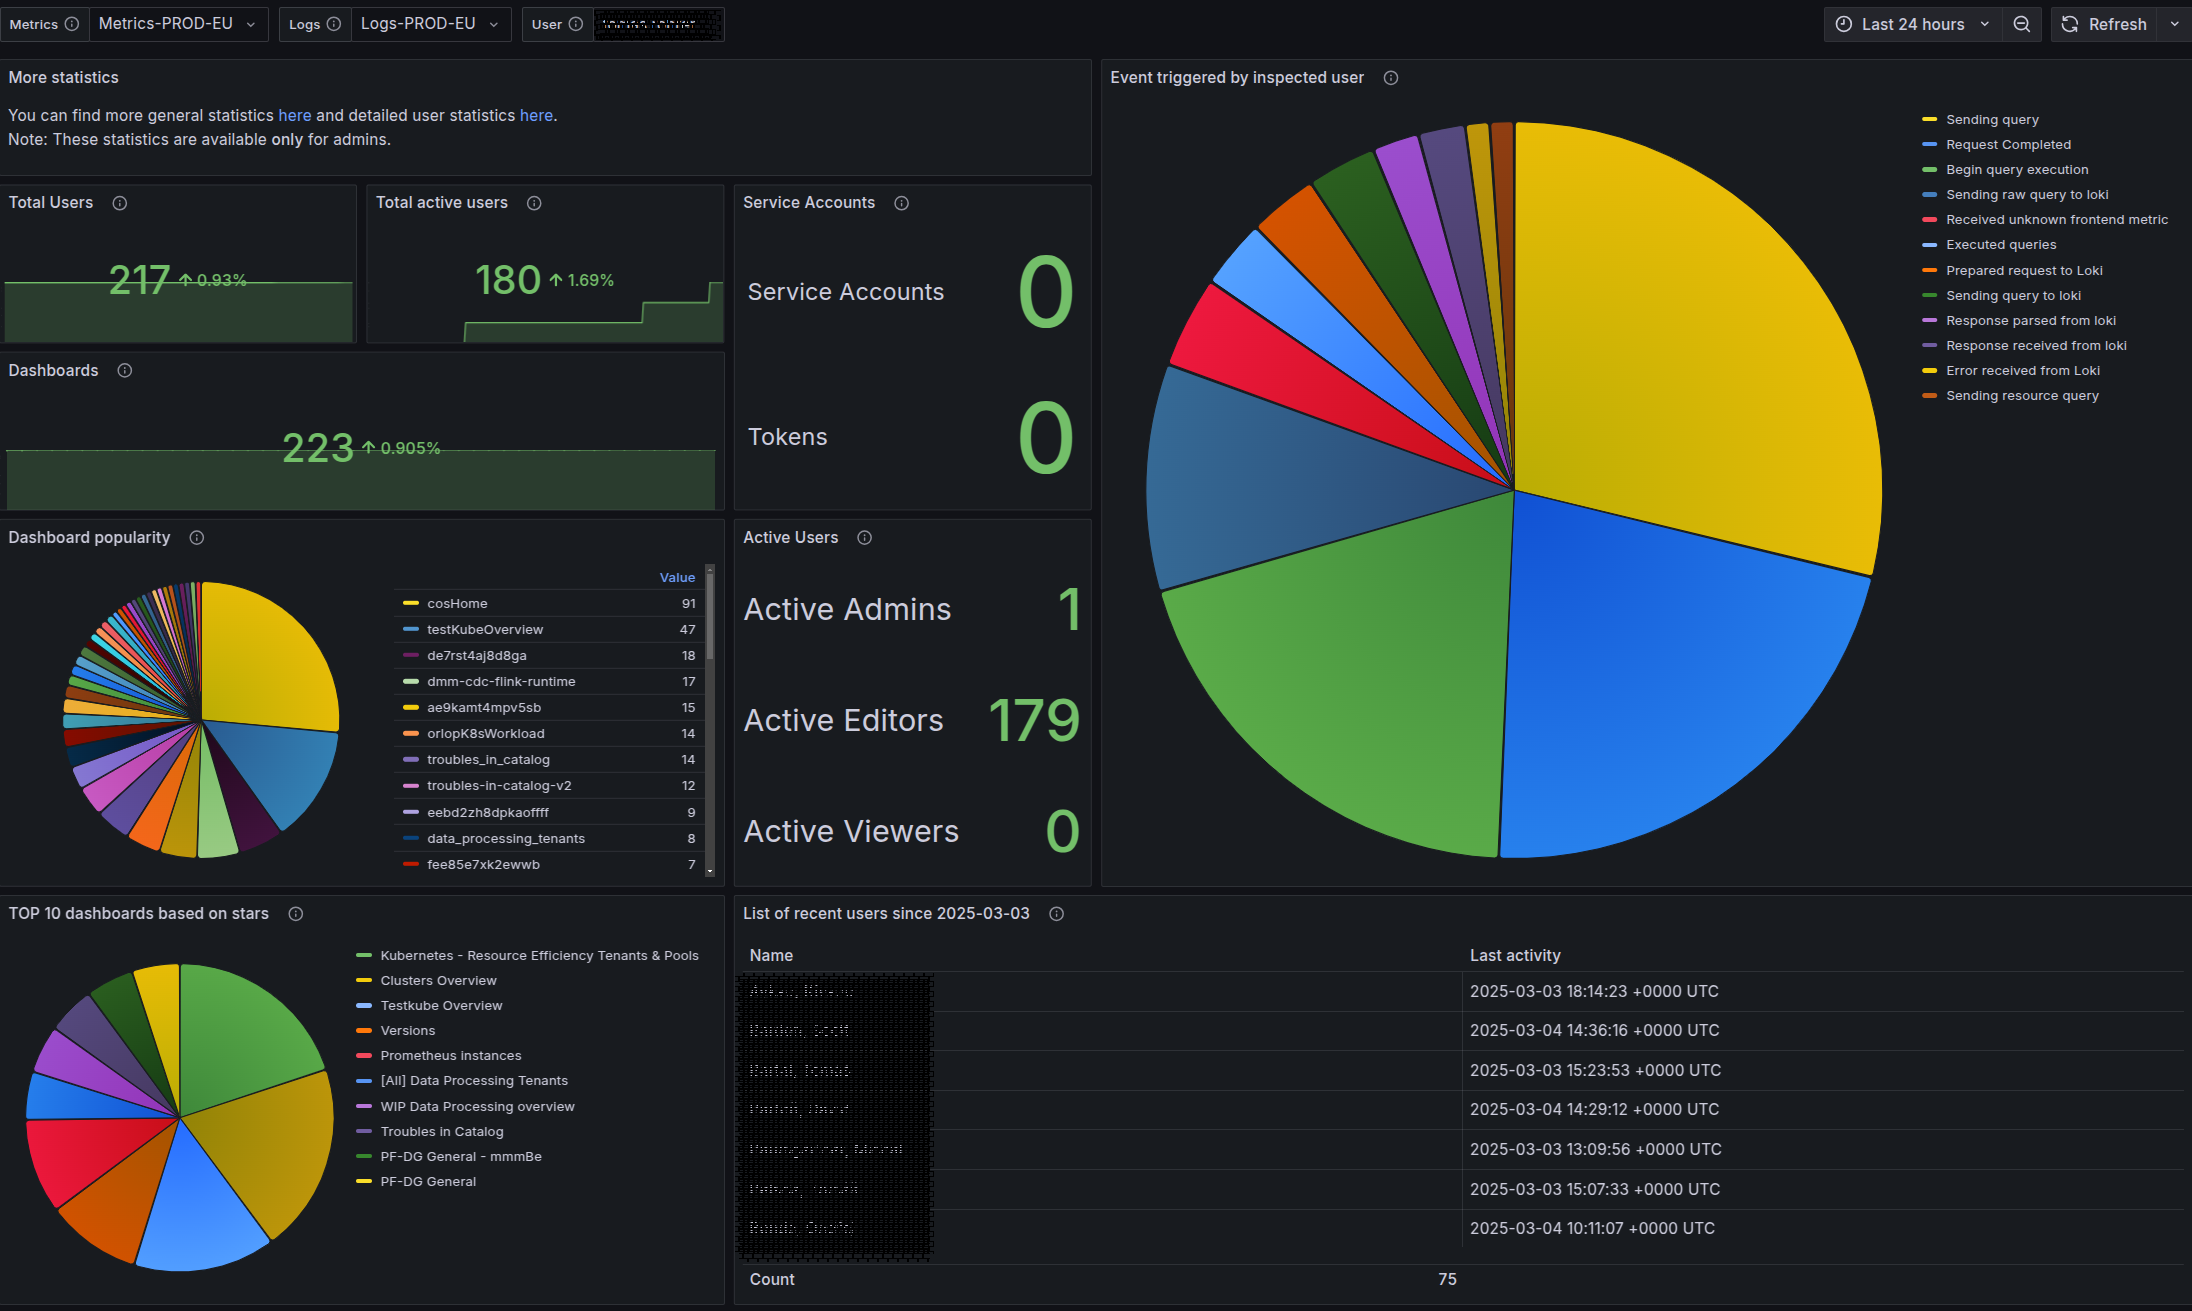
Future and Conclusion
We’re still improving and refining our Observability platform as our SaaS products evolve. While the foundation is solid, there are several areas where we plan to enhance our stack further:
- Enhancing automation – Improving our CI/CD pipelines to enhance the quality of delivered objects, such as implementing a Grafana dashboard linter and other validation mechanisms
- Expanding tracing adoption – While traces were a lower priority during the initial rollout, we now aim to encourage more teams to fully leverage distributed tracing for better root cause analysis
- Replacing deprecated Promtail – Preparing to replace Promtail due to its deprecation, with its end-of-life set for March 2026.
- User experience enhancements – Streamlining dashboards, improving alerting mechanisms, and making it even easier for engineers to access and analyze their data
Building a reliable observability stack at Ataccama wasn’t just about selecting the right tools — it was about changing how teams think about observability altogether.
We started from a fragmented, unowned ecosystem where logs were hard to find, metrics were inconsistently collected, and tracing didn’t exist. By building a self-hosted LGTM stack, we gave teams a unified platform that balances cost, flexibility, and regional data residency requirements.
More importantly, observability now has clear ownership. Teams know who to turn to for help, and observability is becoming an essential part of how they work — not an afterthought.
Observability at Ataccama has gone from scattered tools to a core practice — one that helps engineers do their jobs better every day.